Ask an AI chat what your sales file says and you'll get an answer in seconds. It will sound sure of itself. And some of those numbers will be wrong, in ways you can't see unless you redo the math yourself.
This tutorial shows you why that happens, how to catch it, and how to use The Spreadsheet Analyst, a plugin for Claude that calculates every figure with code against your real rows and tells you up front whether your file can answer the question at all. Everything shown below is real output from the plugin's demo files. Not on Claude? Sections 02, 03, and 10 work on their own.
The Spreadsheet Analyst at a glance
The Spreadsheet Analyst reads an Excel file, a CSV, or rows you paste into the chat and tells you, in plain language, what the data actually says. Before it answers, it gives you a verdict on whether the data can support your question. Then it does the job you asked for: a quick read, a direct answer, a comparison, a cleanup, a report you can send, or research statistics with an APA write-up.
Plugin
The Spreadsheet Analyst
Drop in a spreadsheet. Get an honest read on what it says, with every number checked by code.
Downloads (pick the one for where you use AI)
No accounts, no API keys, no extra software. Claude app on your computer: the .plugin. Claude in a browser or Claude Code: the .zip. ChatGPT or Gemini: portable-prompt.md. Install steps are in Section 09.
What you walk away with
- A one-screen read of any spreadsheet: the headline, what's driving it, what looks odd, and what the file can't tell you.
- A verdict before every answer, so you know when a number is safe to repeat.
- Numbers that match your sheet, because code calculated them from its rows.
- Finished files when you need them: a printable report with charts, an Excel workbook with live formulas, or a cleaned copy with a change log, each with a short covering note.
- For school and research: the right statistical test, an APA-style sentence, a results paragraph, and a table.
What it does well
Exact math
Totals, averages, shares, and changes are computed by bundled scripts on your actual rows. Pasted rows get saved to a file first, so they get exact math too.
Reads messy real exports
Title rows, TOTAL rows inside the data, prices stored as text, ambiguous dates, months as columns. It finds them and tells you, by row number.
A verdict first
Ready, Ready with caveats, Fix first, or Can't answer from this. It's allowed to give you the inconvenient one.
Six ways of working
Quick Read, Answer a Question, Compare, Clean & Fix, Report & Charts, and Academic & Research. No single template forced on every file.
Files you can audit
Workbook totals are live Excel formulas pointing at a Data sheet. Click any figure and see where it came from.
It remembers
An optional four-question setup, plus memory of each file's layout, so next month's export is compared with last month's without re-explaining your columns.
Where it falls short
- Exact math needs a setup that can run code. Without one, it sticks to small tables and labels every figure as hand-calculated.
- It reads the values your spreadsheet last saved and won't recalculate formulas.
- Older formats (.xls, .numbers, .ods) and tables inside PDFs need re-saving as .xlsx or .csv first. A live Google Sheet needs downloading unless you have a drive connector.
- It won't claim cause and effect from data that only shows things moving together, and it won't invent benchmarks like "the industry average is 2%".
- Advanced research designs (mixed or logistic models) get a named method and template, not a computed result.
- The portable prompt for other AIs carries the method but not the scripts, so its math is only as good as that AI's own code tool.
Who it fits
Business owners with sales exports, budgets, or ad reports. Employees handed a file and a deadline. Students and researchers who need the right test and a write-up they can defend. People tracking their own money. If you've ever pasted a table into a chatbot and wondered whether the total was right, it's for you.
Why AI gets spreadsheet numbers wrong
Language models predict text. When one adds up a column "in its head", it's reaching for a plausible number, and it's often close. Close is the dangerous part: a total that's 3% off looks exactly like one that's right. A typical "paste your rows" prompt also never checks for title rows, subtotals, or duplicates, or asks whether the data can answer the question at all.
How to spot a wrong number
- No basis given. "Revenue was $184,000" with no mention of which rows or column. A trustworthy figure says what it's a sum of.
- It doesn't match your sheet's TOTAL row, and nobody explains why. A good answer names the gap: duplicates, numbers stored as text, a stale total.
- Suspiciously round numbers. Real data produces figures like $30,257.33. "About $30,000" is a guess.
- Percentages of tiny groups. "60% of Team East is satisfied" means little if Team East is five people.
- Benchmarks you never supplied, and cause-and-effect words like "drove" or "led to". Your file can show two things moving together. It usually can't show why.
Quick test: Ask any AI tool for the grand total of one column in a file you already know well. If its number doesn't match yours to the cent, don't trust its percentages either.
What "messy" looks like in a real export
Files from point-of-sale systems, accounting software, survey tools, and bank portals each add their own clutter. These are the problems The Spreadsheet Analyst looks for, and what each one does to your numbers if nobody notices.
| Problem | What it looks like | What goes wrong |
|---|---|---|
| Title rows | A report title in row 1, headers in row 2 | Every column name comes out wrong. |
| Total rows inside the data | A TOTAL or Subtotal row between months or at the bottom | Sum the column and you count everything twice. |
| Numbers stored as text | "$129.00" in a cell Excel treats as words | Excel's own SUM skips it, so the sheet's total comes up short. |
| Ambiguous dates | 03/04/2026 in every row | March 4 or 3 April? Guess wrong and sales land in the wrong months. |
| Exact duplicates | Two identical rows, order number included | Revenue and order counts come out high. |
| A stale summary tab | A pivot built last month | It disagrees with the data, and nobody knows which is right. |
| Months as columns | Jan, Feb, Mar across the top | Time questions need the months as rows first. |
Some fixes happen automatically because they don't change meaning, like skipping a title line or reading "$129.00" as 129. Others need your OK, because only you know the answer: are those two identical rows a double entry, or did the same customer really order twice? Here's the cleanup plan it produced for the demo sales file:
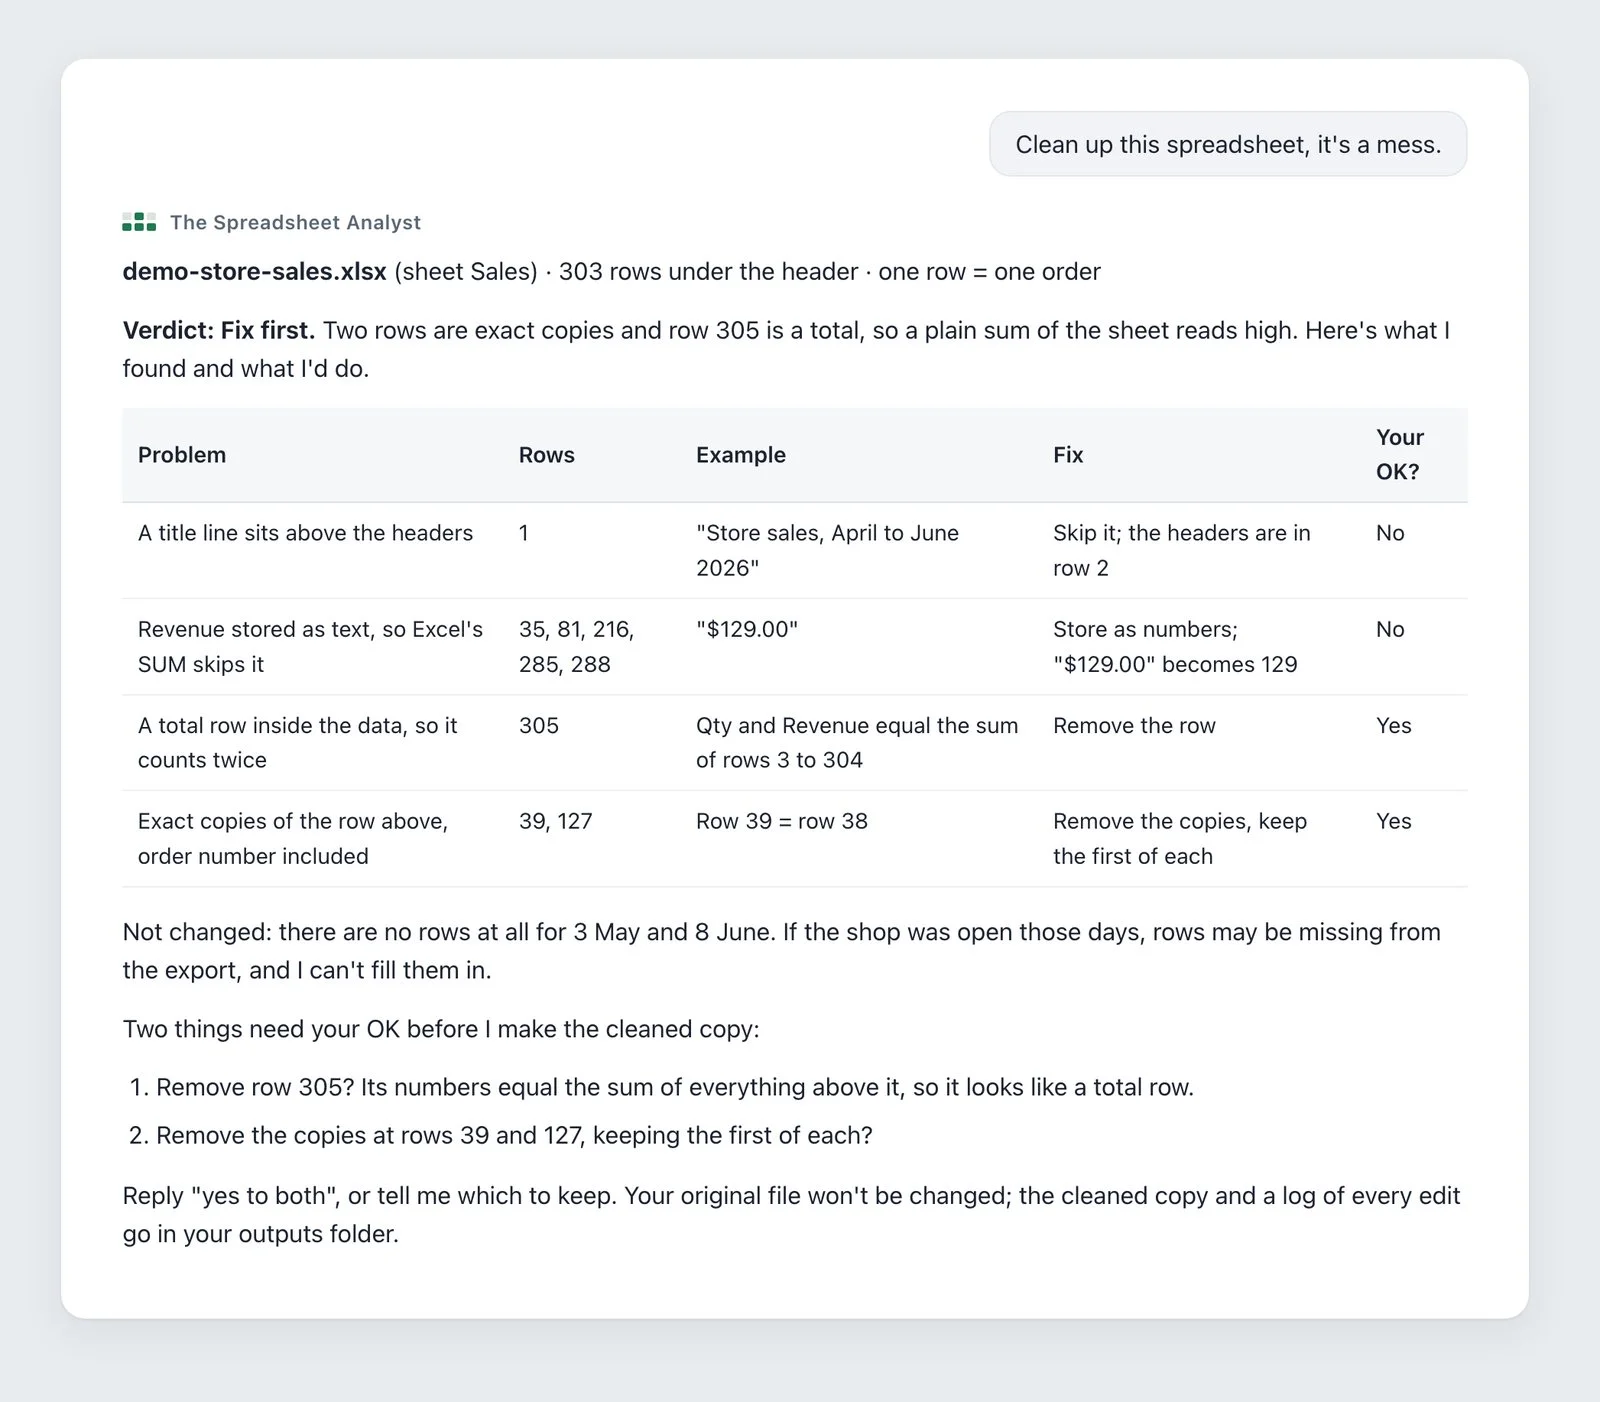
Your original is never touched. A cleanup produces a new file plus a change log listing every edit by row. Blanks are never filled with guesses: a made-up value looks exactly like a real one once it's pasted into a slide.
The verdict comes before the answer
This is the step a typical "summarize my data" prompt skips, and it's the one that saves you from the awkward meeting. Before any analysis, The Spreadsheet Analyst tells you in one to three lines whether your data can support what you asked.
Ready
The data can answer this. Go.
"1,482 order lines, Jan to Jun, every needed column complete."
Ready, with caveats
It can answer, with limits named out loud.
"Region is blank in 46% of rows, so the regional split is shaky."
Fix first
Something would make the numbers wrong if taken at face value.
"12 rows repeat another row exactly, so revenue reads 1.4% too high."
Can't answer from this
The question needs data the file doesn't have.
"Profit needs costs, and this file has revenue only. Here's revenue by product instead."
"Fix first" always puts a size on the damage, because "overstated by 1.4%" gets fixed where "some quality issues" gets ignored. "Can't answer from this" names the column that would fix the problem, then answers the closest question it can. Disagree? Say so, and it goes with your call.
Push it to "prove the campaign worked" and you'll get the before-and-after number, a sentence that's safe to paste into an update, and what data would settle it next time. It won't hunt through filters for a flattering cut.
Six modes, no special wording
You don't pick a mode from a menu. Ask the way you'd ask a colleague and it routes itself.
Quick Read
The headline, what's driving it, what looks odd, and what the data can't tell you. One screen.
"What does this spreadsheet say?"Answer a Question
The number in the first sentence, how it was worked out, and a line you can forward as is.
"Which customers owe us the most?"Compare
What changed and what drove it, after checking you're comparing like with like.
"Compare June to May."Clean & Fix
A list of problems for your OK, then a new cleaned file and a change log.
"Clean up this spreadsheet."Report & Charts
A printable report with charts, an Excel workbook with live formulas, or both, plus a covering note.
"Make a report for my boss."Academic & Research
The right test explained in plain words, with effect size, an APA sentence, a results paragraph, and a table.
"Is this difference significant?"It also adapts to the kind of data. A gradebook gets asked whether blank scores count as zero. An ad report gets click rates computed from totals, with a warning when that ranks channels differently from a dashboard's weekly averages. You don't need to know those traps exist. An optional four-question setup ("set up my spreadsheet analyst") saves your date format and preferences so it never asks again.
Walkthrough: the demo file, with real numbers
The plugin ships with demo-store-sales.xlsx: three months of sales from a small coffee equipment shop. Type "show me a demo" and it runs a Quick Read on it. Before saying a word, it read the file properly and found a lot of clutter for 305 rows:
- Row 1 is a title line; the real headers are in row 2.
- Row 305 is a total row. Its numbers equal the sum of everything above it, so it's left out.
- Five Revenue cells hold numbers stored as text, like "$129.00". Excel's own SUM would skip them.
- Rows 39 and 127 are exact copies of the rows above them, order number included.
- No sales at all on 3 May or 8 June. Closed, or missing rows? Worth checking.
The duplicates sit inside the data, so any total that includes them is too high. That makes the verdict Fix first, with the damage measured: $86.99. Here's the read it produced:
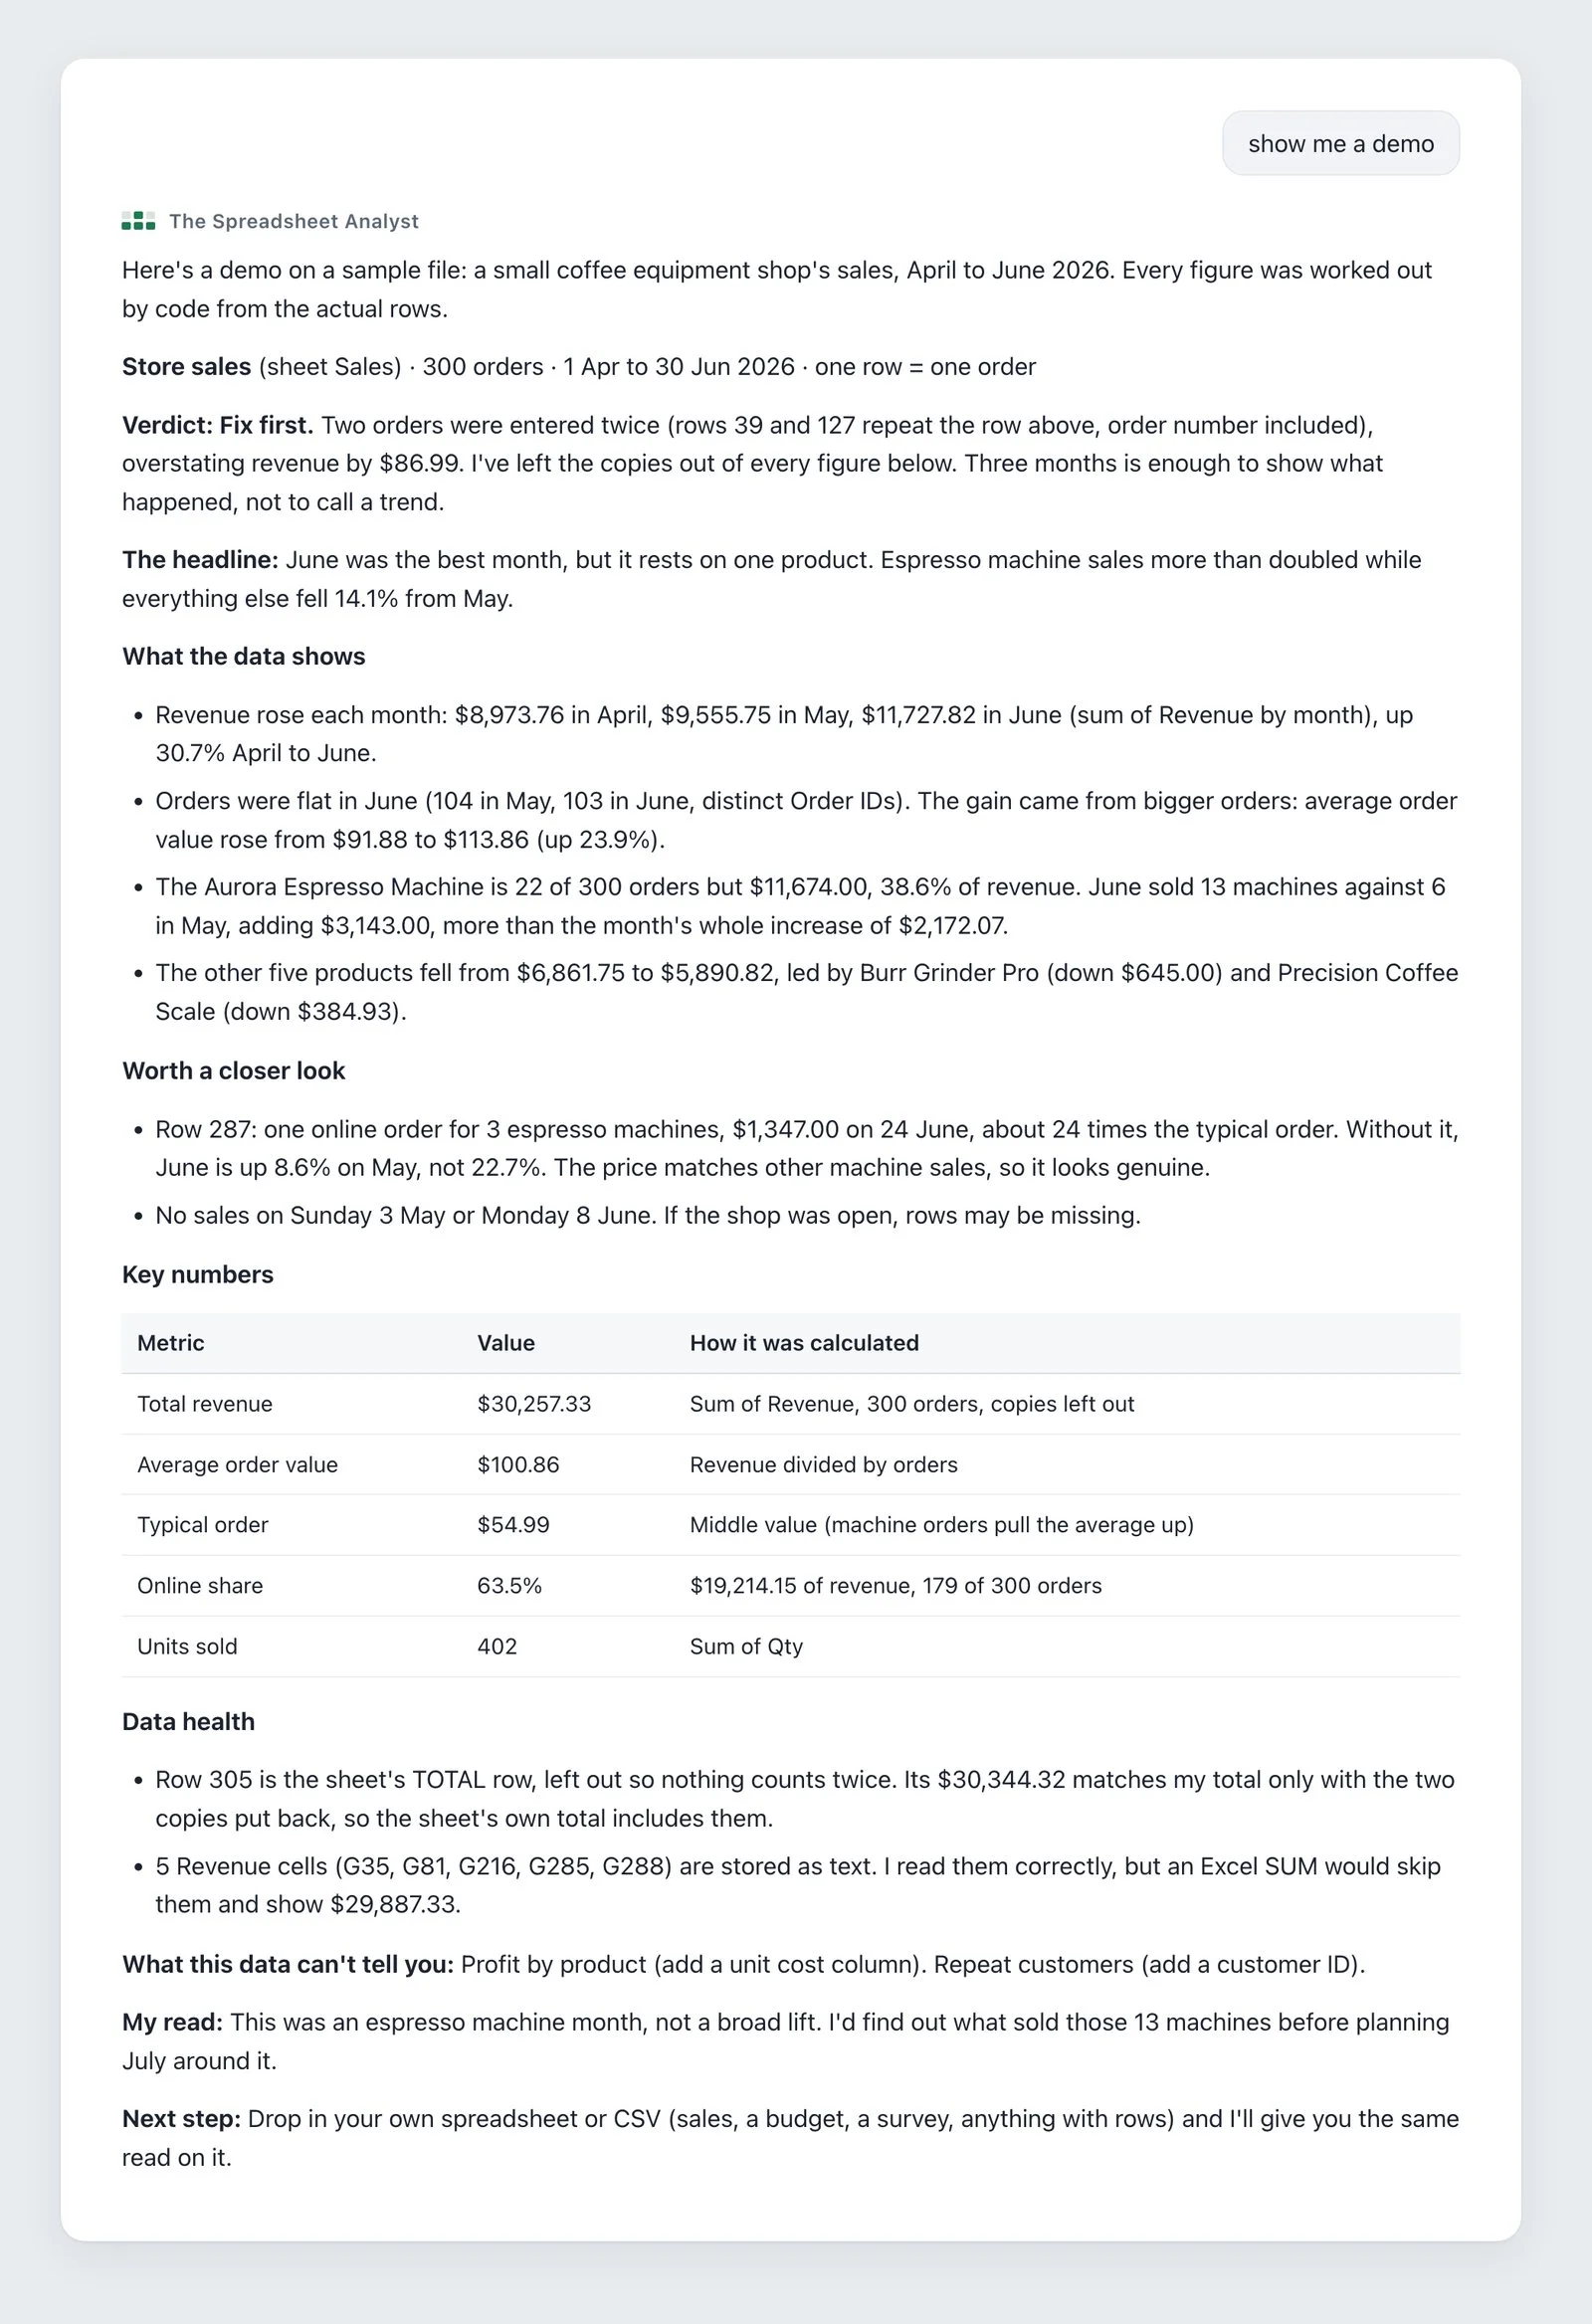
Read it like an analyst would
The flattering fact is that revenue grew every month. The useful fact is that orders didn't: 104 in May, 103 in June. Growth came from bigger baskets, and the bigger baskets came from one $449 espresso machine. Then look at "Worth a closer look": a single order for three machines on 24 June. Without it, June is up 8.6% on May, not 22.7%. That's the kind of finding that changes a plan, and it's why the plugin ranks a risk above a nice-looking total.
Notice what it left out: no "trend" from three months of data, no invented industry average. And it shows the typical order ($54.99) beside the average ($100.86), because a few machines drag the average far above what a normal customer spends.
Check it yourself: Open a copy of the demo file and convert the five text cells (G35, G81, G216, G285, and G288) to numbers with the warning icon's Convert to Number. Delete rows 39, 127, and 305, then sum column G. You'll get $30,257.33. Skip the conversion and you'll get $29,800.34, which shows exactly why text numbers matter.
Reports, workbooks, and the covering note
Chat answers are fine for you. The moment someone else needs the numbers, you want a file. Ask for "a report for my boss" or "an Excel file I can keep updating" and it picks the format from what you said.
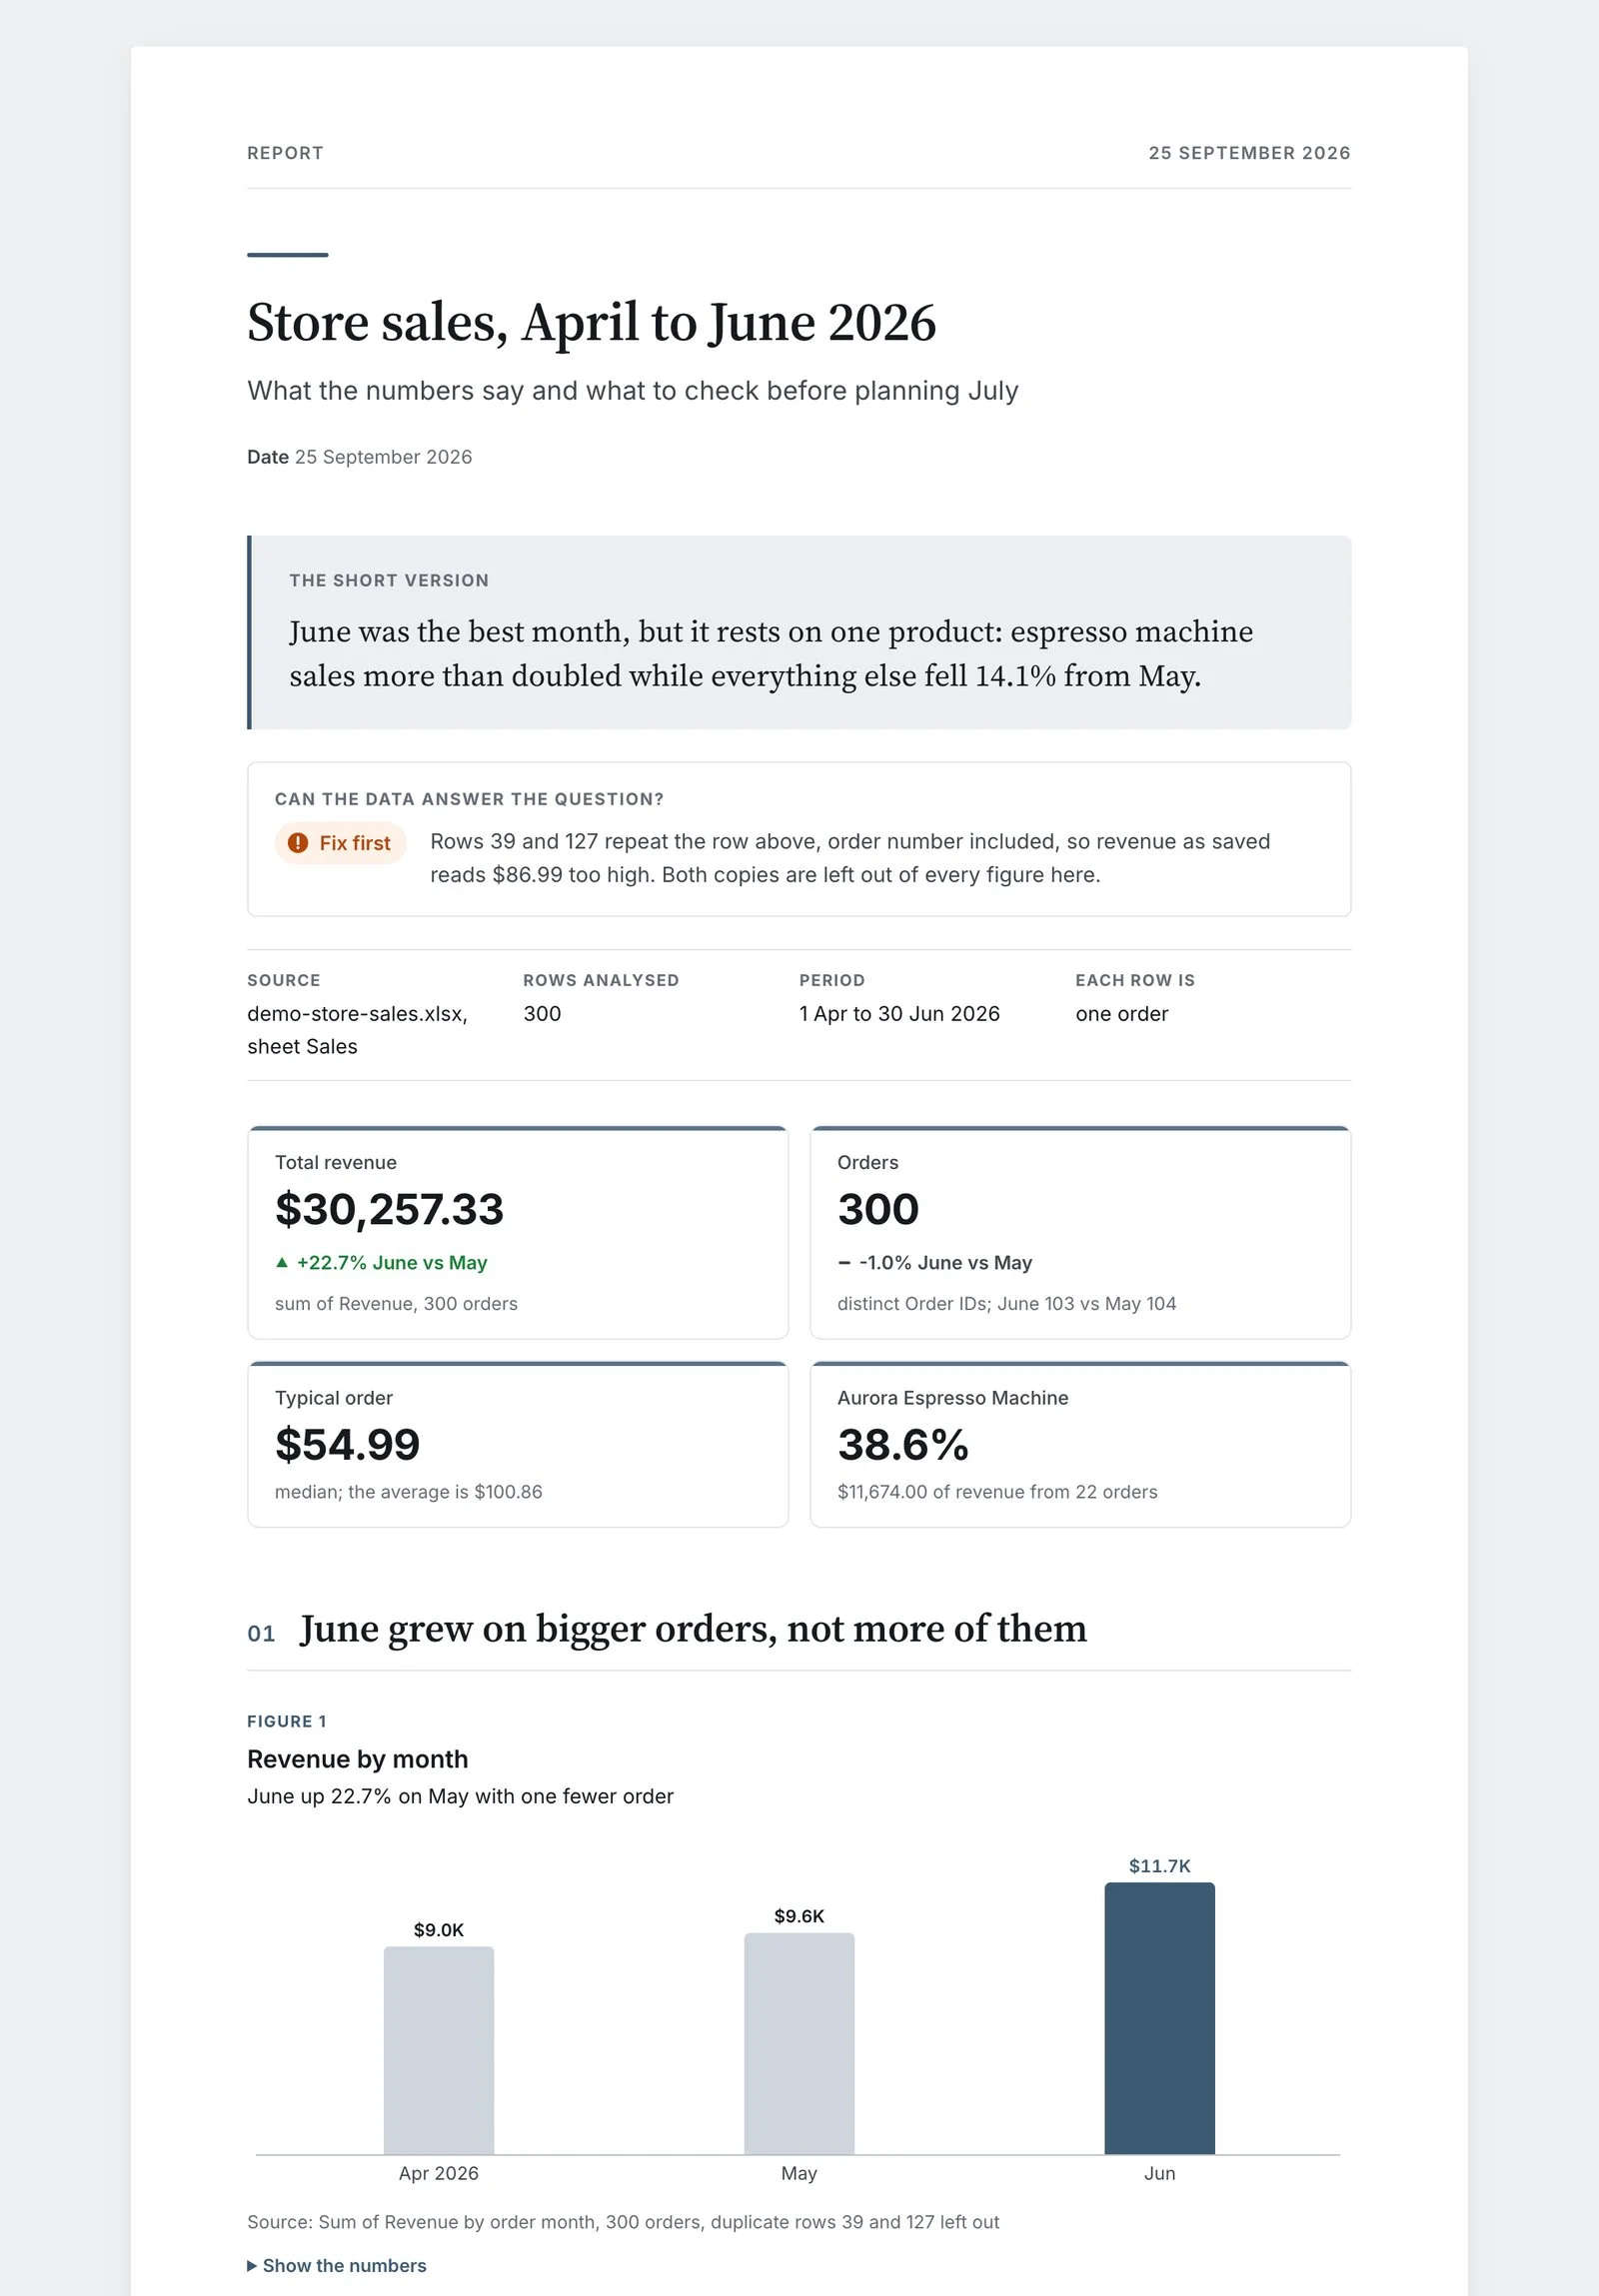
The HTML report
Best for sending, printing, or saving as a PDF. The headline states a finding with a number, and every chart has a takeaway subtitle and a source note naming the rows it summarizes. Bars start at zero, always.
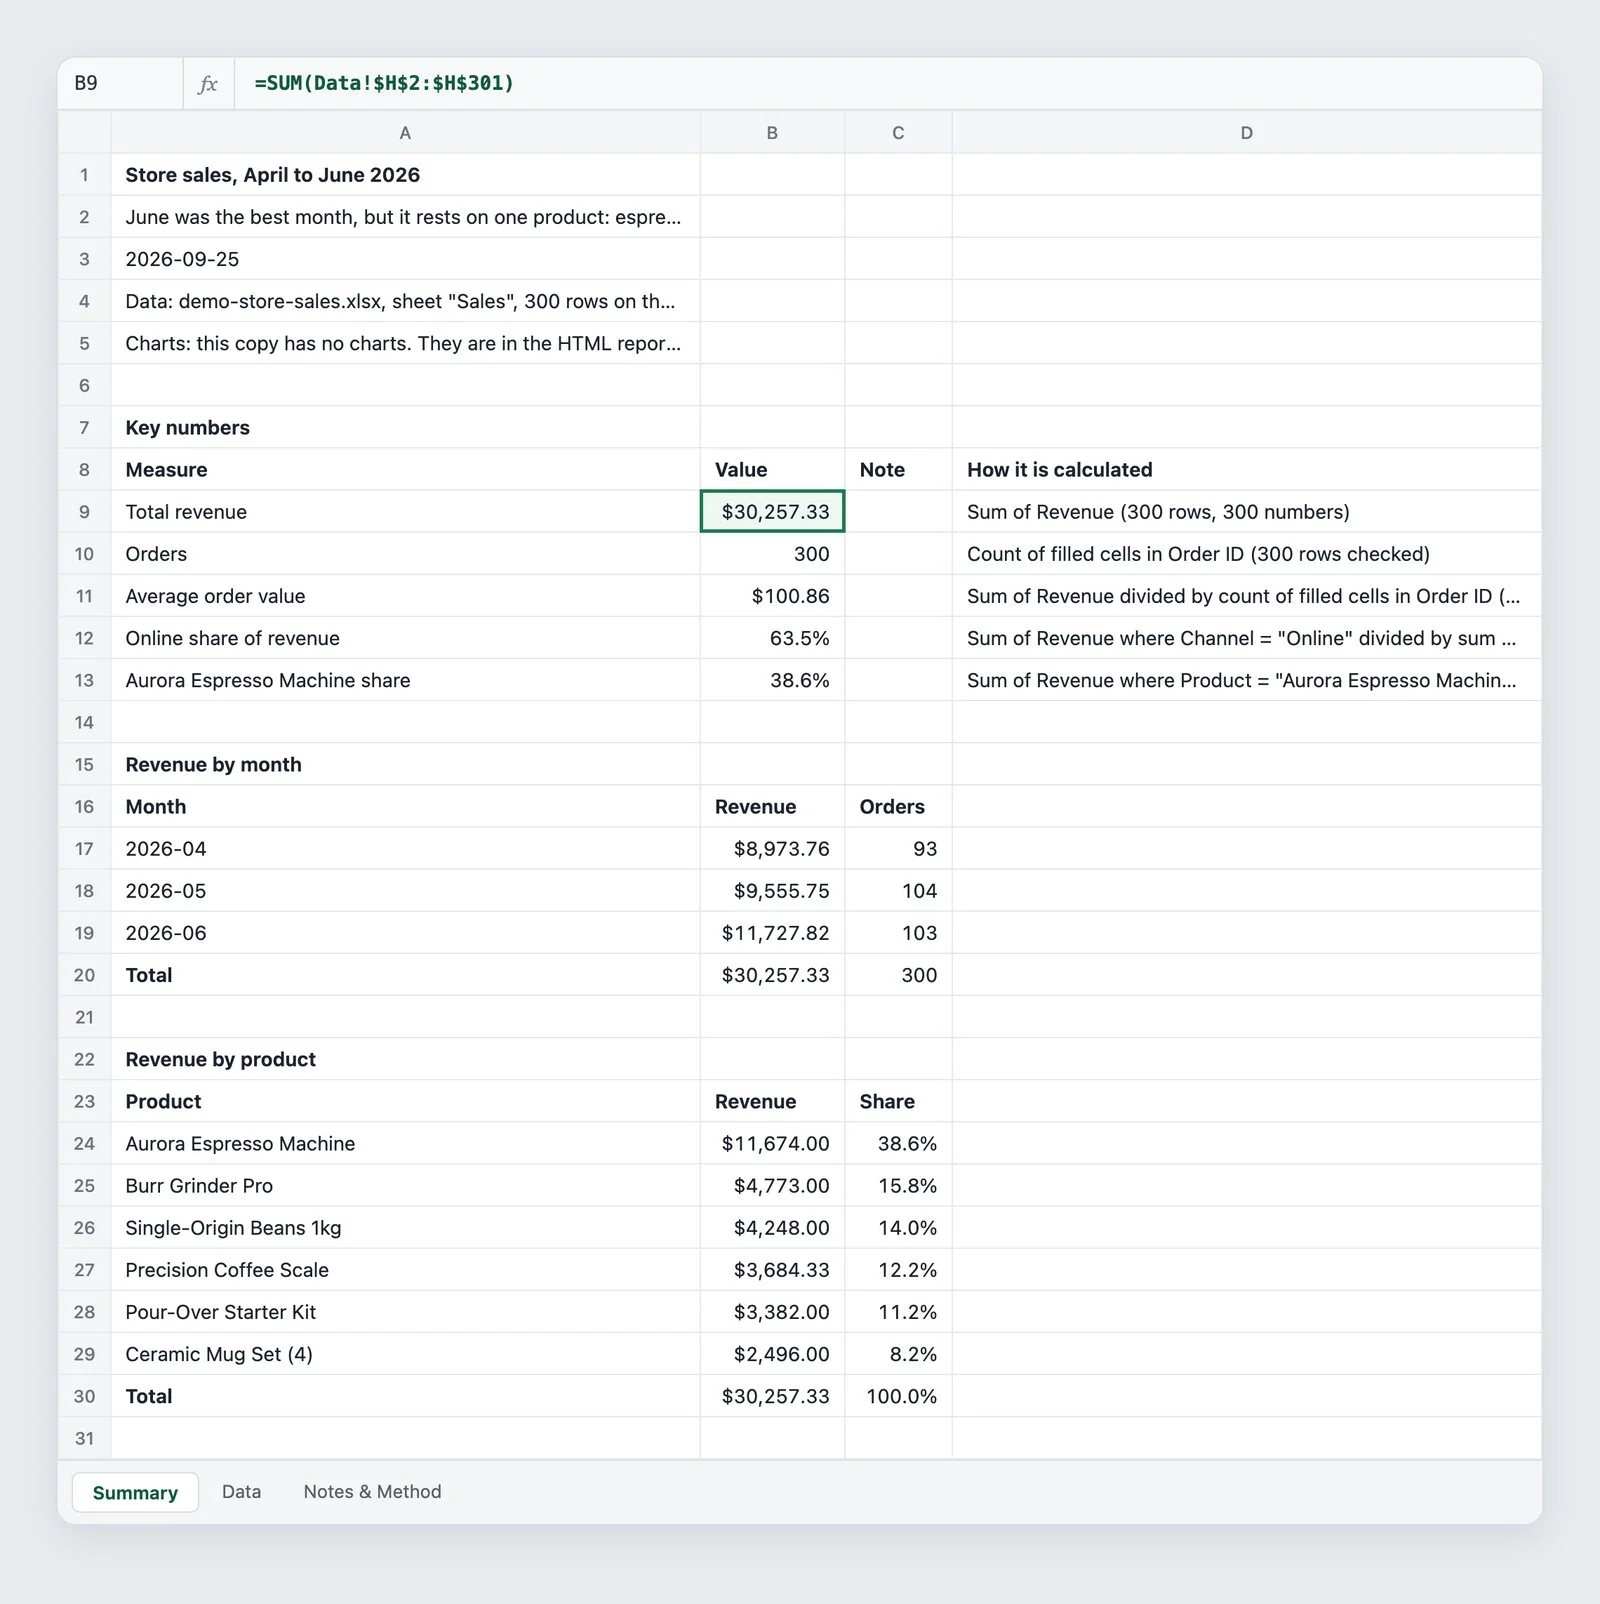
The Excel workbook
Best when you'll keep working with the numbers, or someone will ask where they came from. Summary figures are live formulas pointing at a Data sheet, so clicking Total revenue shows =SUM(Data!$H$2:$H$301). Before handing it over, the plugin recalculates every formula from the saved file and checks it against its own answer. If Claude's environment lacks the Excel chart library, the workbook says so and the charts go in the HTML report.
The covering note
A file on its own is half a deliverable, so every report or workbook comes with a short note you can paste into an email. For the demo file, sent to a manager:
Everything it creates lands in spreadsheet-analyst/outputs inside the folder you're working in, with plain names like demo-store-sales - report - 2026-09-25.html.
Academic and research mode
Students and researchers need to know whether a difference is real, and how to write it up so it survives a thesis defense. This mode asks at most three questions about your design, then picks the test and tells you why. Here it is on the demo survey, asked whether likelihood to recommend differs by plan:
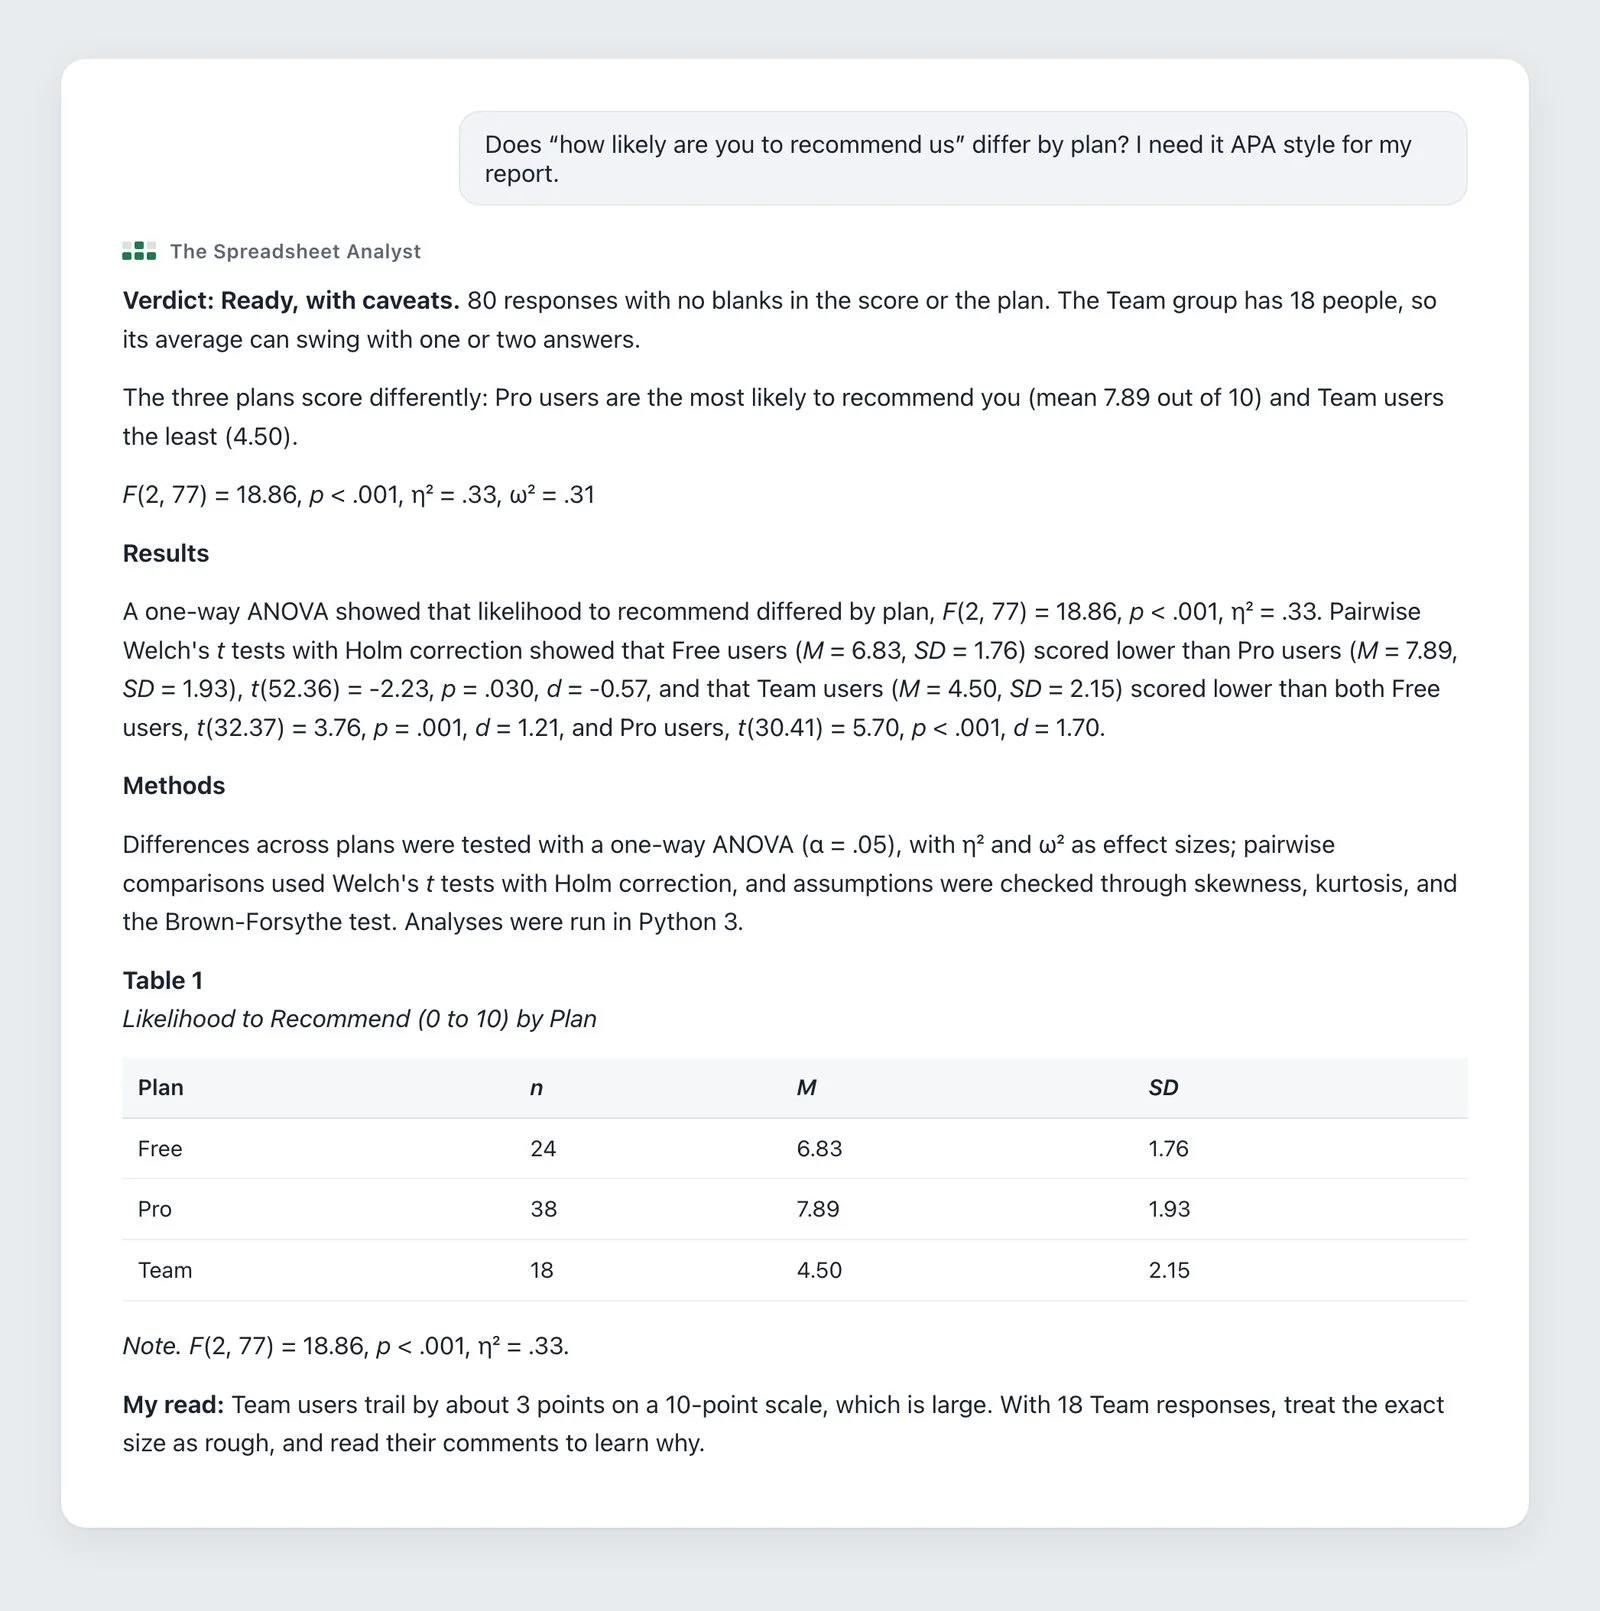
In plain words: the plans really do score differently, and plan accounts for about a third of the spread in scores (η² = .33). With only 18 Team users, the verdict carries a caveat for your limitations section.
Where it draws the line
- It won't hunt for significance. Dropping outliers until p falls under .05, or trying tests until one works, is p-hacking, and it declines.
- It never alters or drops data to change a result. A 999 on a 0 to 100 scale is an entry error and gets treated as missing; an unusual but real score stays in.
- It reports non-significant results properly: "no evidence of a difference", never "no difference".
- It leaves the interpretation to you and reminds you to follow your institution's policy on AI assistance.
Installing it in Cowork, claude.ai, and Claude Code
Pick the route that matches where you use Claude. Anthropic has changed its menus several times this year, so if a label doesn't match your screen exactly, look for the closest equivalent.
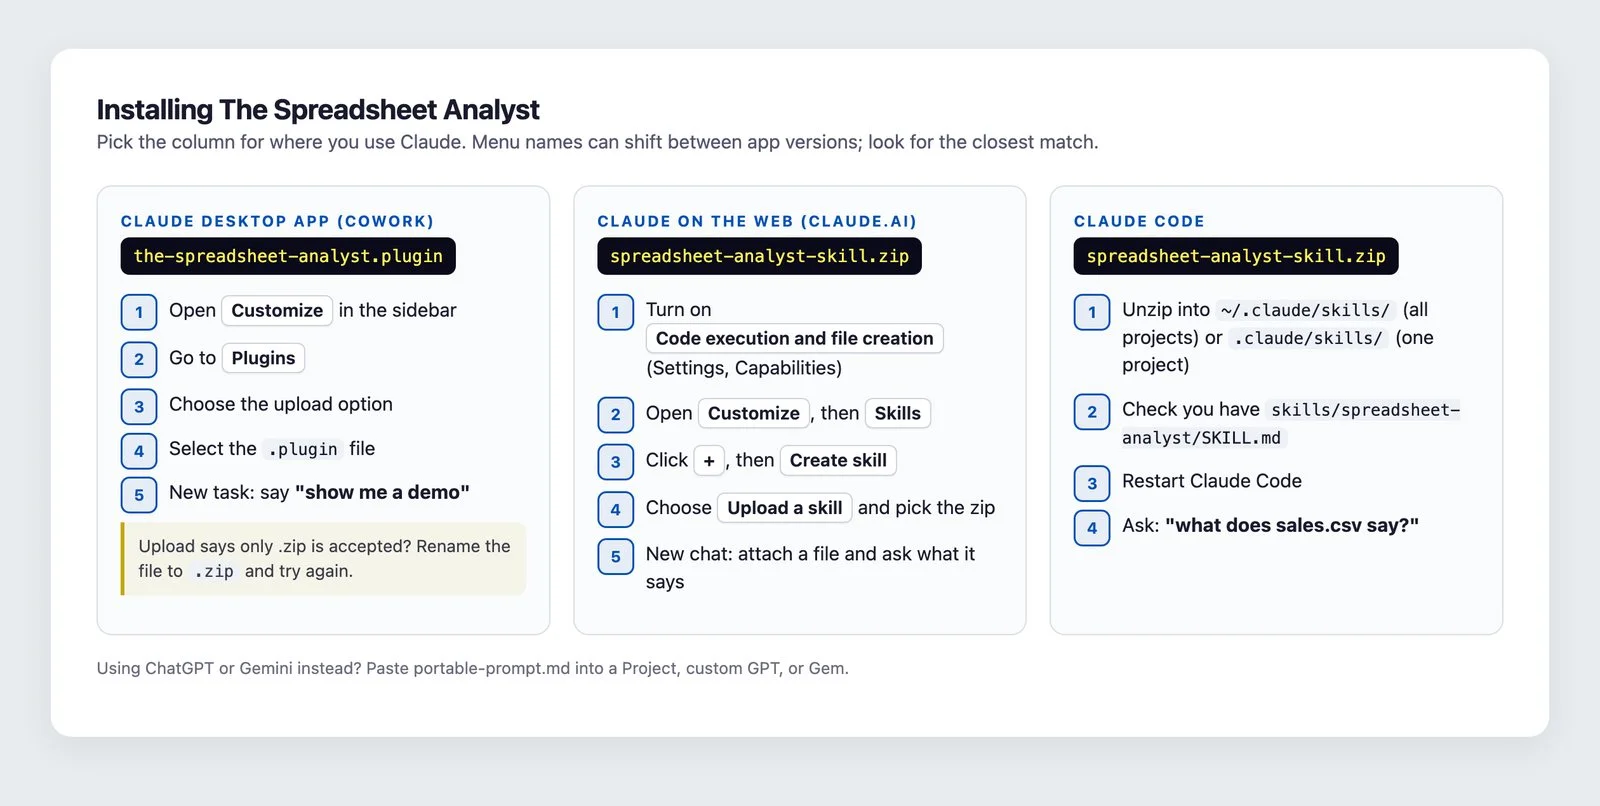
Claude desktop app (Cowork)
Plugins in Cowork need a paid Claude plan (Pro, Max, Team, or Enterprise). Open Customize in the sidebar, then Plugins, choose the upload option, and select the-spreadsheet-analyst.plugin. If it says only .zip files are accepted, rename the file to the-spreadsheet-analyst.zip and upload again; a .plugin file is already a zip, so nothing breaks. Team and Enterprise admins can add it for everyone under Organization settings, then Plugins & skills, then Add (that route asks for a .zip under 50 MB).
Claude on the web (claude.ai)
Make sure Code execution and file creation is on (Settings, then Capabilities; on Team and Enterprise it's under Organization settings). Then go to Customize, Skills, click +, choose Create skill, then Upload a skill, and pick spreadsheet-analyst-skill.zip without unzipping it. On the Free plan and can't find the option? Anthropic's pages disagree on whether Free includes custom skills.
Claude Code
Unzip spreadsheet-analyst-skill.zip into ~/.claude/skills/ (all projects) or .claude/skills/ inside one project, check you have .../skills/spreadsheet-analyst/SKILL.md with no extra folder level, and restart Claude Code.
If it doesn't kick in: name it in your request ("Use the spreadsheet analyst on this file"). On claude.ai, check that Code execution and file creation is on first, because skills won't load without it.
Using the portable prompt in ChatGPT or Gemini
The file portable-prompt.md carries the same method as copy-paste text. It can't carry the scripts, so it tells the AI to use its own code tool for every number.
Put the Full version in a ChatGPT Project, a custom GPT, or a Gemini Gem so it stays between chats. It's under 8,000 characters, the limit users commonly report for ChatGPT's instruction boxes (OpenAI's own pages don't confirm it). For a one-off, paste the Quick version into a chat, fill in the brackets, and attach your file:
- Upload the file instead of pasting. Pasting loses sheets, date formats, and anything below the visible rows.
- Watch for code. If the AI shows the code it ran, the math is being done properly. If it just answers, treat every number as a draft and check the totals against your sheet.
- In Google Sheets, the Ask Gemini panel turns analysis requests into Python and runs it. It needs an eligible Google Workspace or Google AI plan and works best on native Sheets files (File, then Save as Google Sheets).
Your next step
Give it ten minutes on a file you already know, so you can judge it against numbers you trust:
- Install it (Section 09) and type "show me a demo". Read the whole Quick Read, verdict included.
- Drop in one of your own files, ideally one whose totals you've checked by hand, and ask "what does this spreadsheet say?"
- Compare its total with your sheet's TOTAL row. If they differ, check that it names the rows causing the gap.
- Read "What this data can't tell you". If it names a column you have elsewhere, add it and ask again.
- Ask for a report or workbook, open it, and click one Summary figure to see its formula.
A lot of the bad numbers that end up in slides and emails aren't lies. They're confident guesses nobody checked. What fixes that is an AI that shows its basis, stops when the file can't answer the question, and hands you figures you can click through to the rows.
So find the spreadsheet you've been avoiding and ask what it says. Watch the verdict. If it comes back "Fix first" on a file you've reported from for months, good. Better to hear it now than from whoever reads your next report.